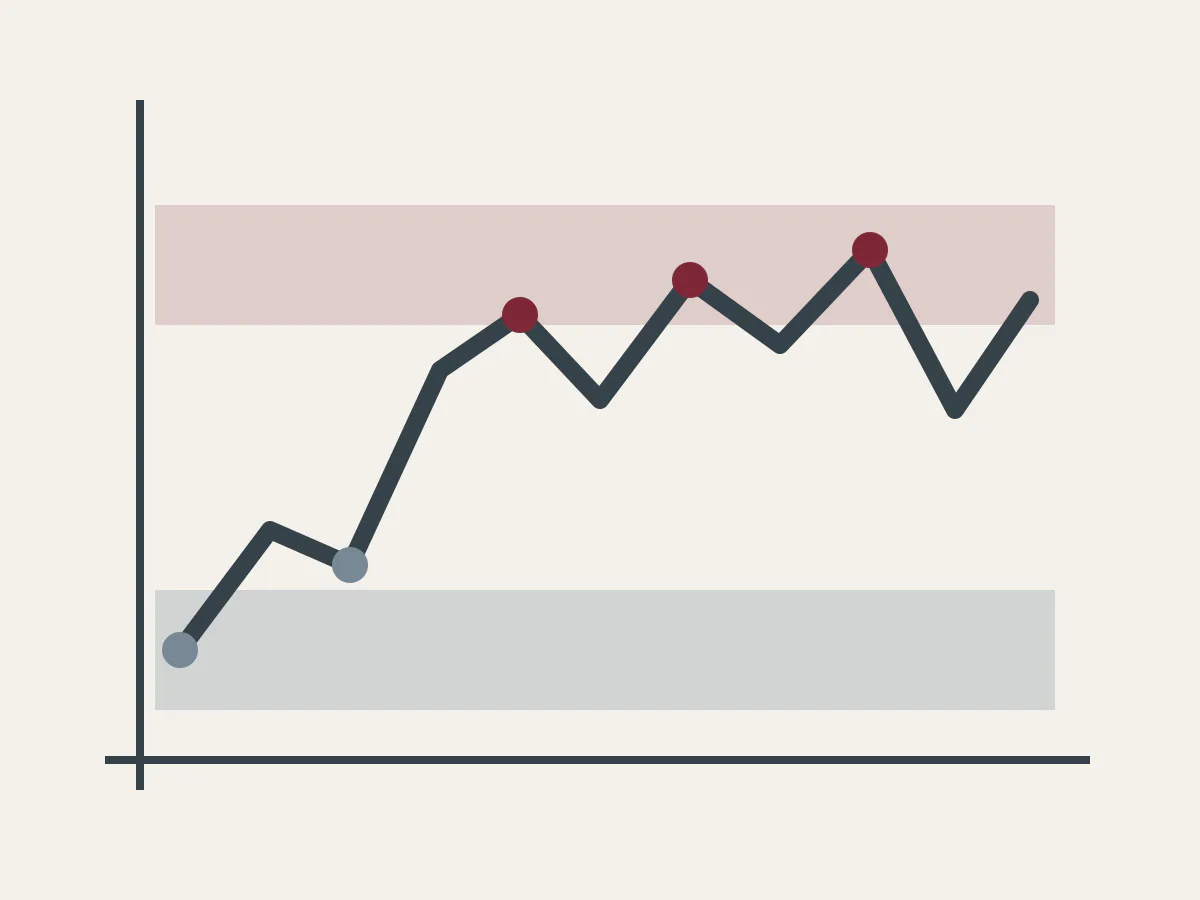
What the labels mean
Support
An area below or near the current observation where downward movement has previously slowed or reversed.
Resistance
An area above or near the current observation where upward movement has previously slowed or reversed.
Why two readers can disagree
Different timeframes
A weekly cluster can disappear inside a shorter intraday sample.
Different anchors
One reader may use closing values; another may include intrainterval highs and lows.
Different widths
A single line suggests false precision. A zone admits that observations rarely turn at one exact value.
A break is an observation, not a forecast.
Moving beyond a marked zone confirms only that the selected data crossed that zone. It does not establish what must happen next.