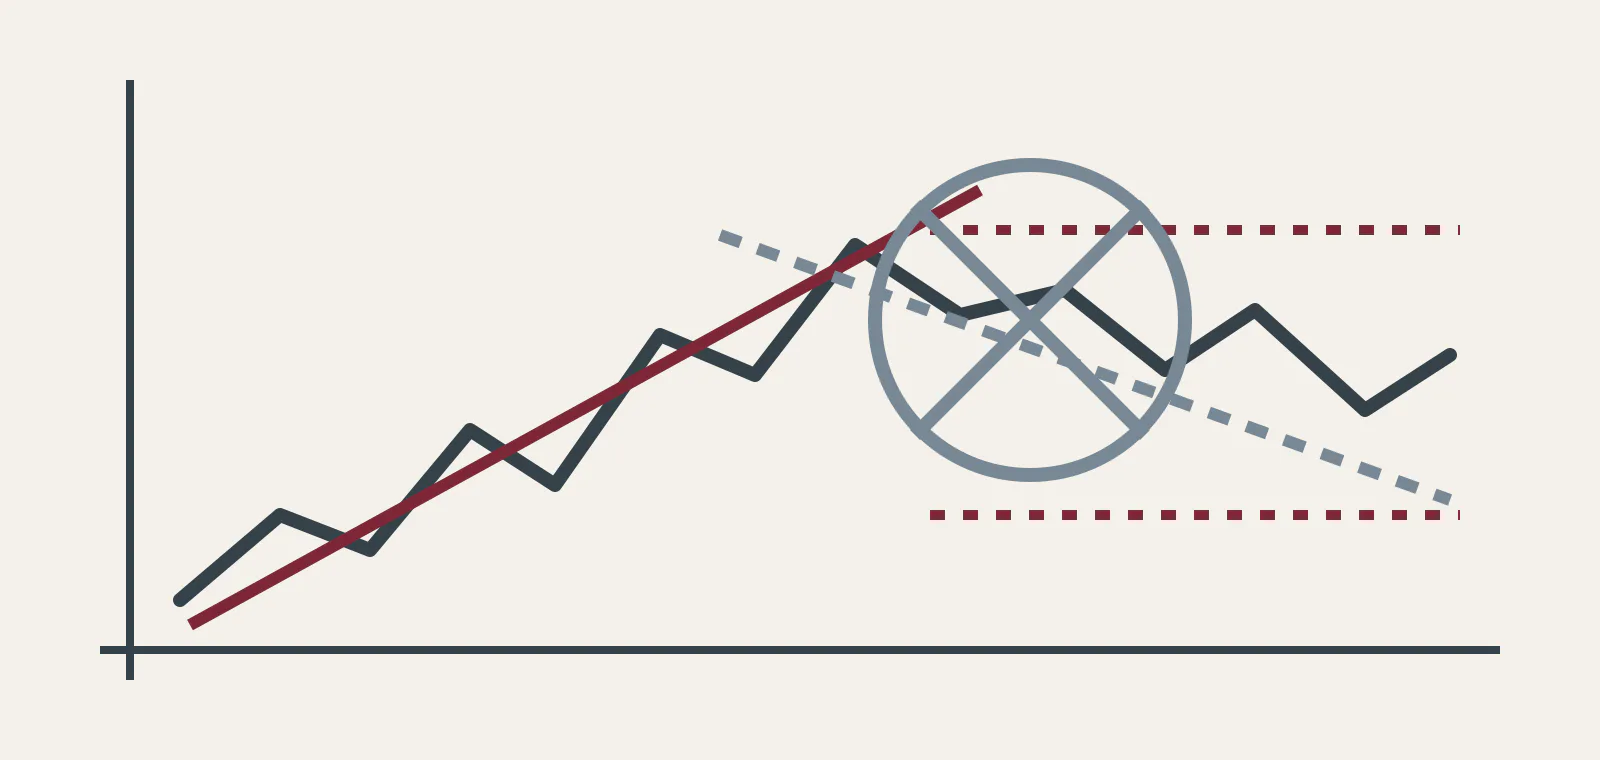
Four checks before any conclusion
What data is missing?
A chart omits fundamentals, costs, liquidity, personal circumstances and information outside the selected sample.
Was the pattern named after the outcome?
Hindsight can make a line look obvious only after later observations are visible.
Could another timeframe reverse the label?
A short rising segment can sit inside a long decline, and a local range can sit inside a larger trend.
What would disconfirm the reading?
A useful description should name its anchors and admit when later data no longer fit.
Past performance does not guarantee future results.
Historical charts, projections and backtests can be presented selectively. Investments involve uncertainty and potential financial loss. Chart literacy does not remove that risk.
Course recap
Observe
Name the interval and chart type.
Describe
Mark highs, lows, ranges and approximate zones.
Limit
State the sample, uncertainty and alternative reading.