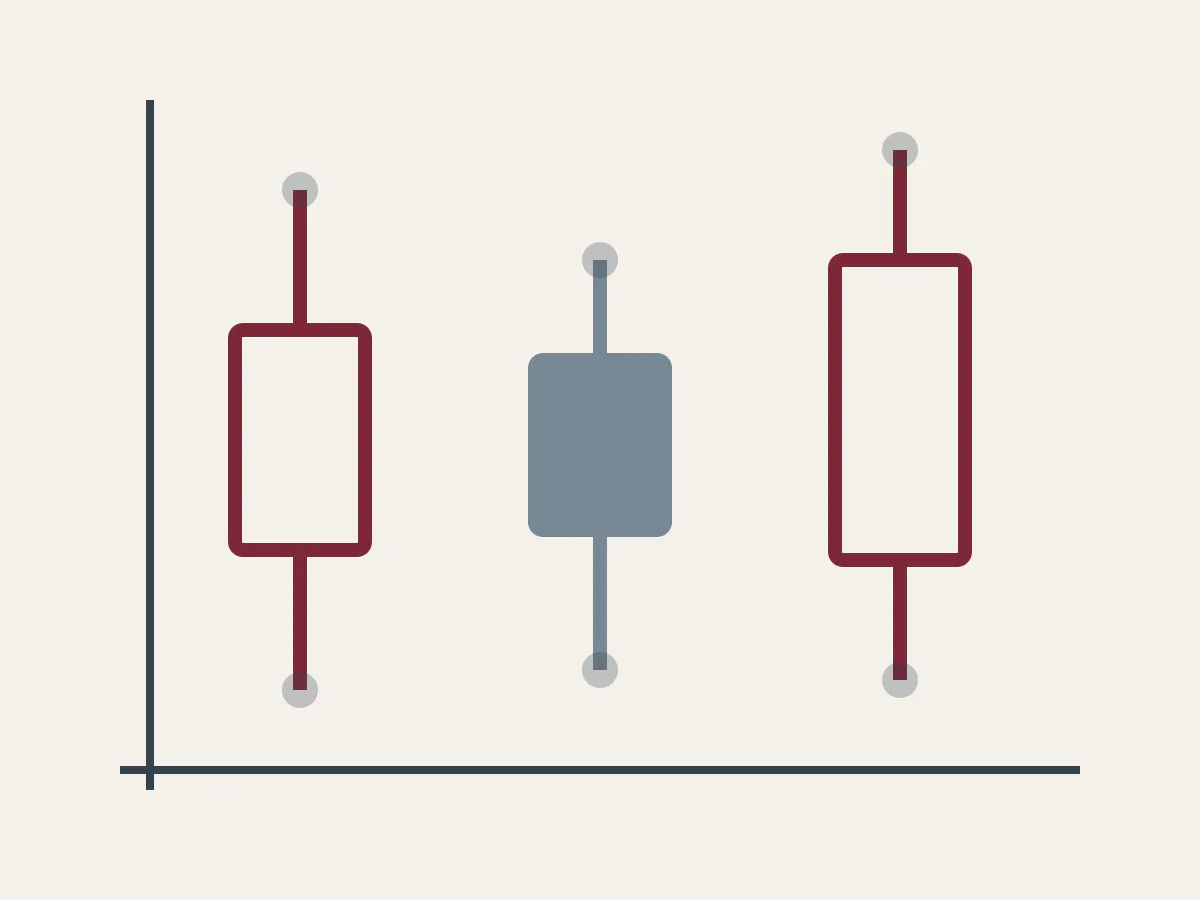
One interval, four prices
Open
The first recorded price in the selected interval.
High
The highest recorded price in that interval.
Low
The lowest recorded price in that interval.
Close
The last recorded price in that interval.
A candlestick body spans open to close. Its wick reaches the high and low. Colour conventions can be changed, so position is more reliable than colour alone.
Three chart forms
Line chart
Usually connects one selected value per interval, often the close. It reduces detail.
Bar or candle
Preserves open, high, low and close for each interval. It adds detail, not certainty.
Timeframe changes the picture.
Five-minute, daily and weekly charts group observations differently. A move that looks noisy in one view can look smooth in another.